Power up your data quality with grouped checks
Imagine you were responsible for monitoring the safety of a subway system. Where would you begin? Most likely, you'd start by thinking about the key risks like collision or derailment, contemplate what causal factors like scheduling software and track conditions might contribute to bad outcomes, and institute processes and metrics to detect if those situations arose. What you wouldn't do is blindly apply irrelevant industry standards like testing for problems with the landing gear (great for planes, irrelevant for trains) or obsessively worry about low probability events like accidental teleportation before you'd locked down the fundamentals.
When thinking about real-world scenarios, we're naturally inclined to think about key risks and mechanistic causes. However, in the more abstract world of data, many of our data tests often gravitate towards one of two extremes: applying rote out-of-the-box tests (nulls, PK-FK relationships, etc.) from the world of traditional database management or playing with exciting new toys that promise to catch our wildest errors with anomaly detection and artificial intelligence.
Between these two extremes lies a gap where human intelligence goes. Analytics engineers can create more effective tests by embedding their understanding of how the data was created, and especially how this data can go awry (a topic I've written about previously). While such expressive tests will be unique to our domain, modest tweaks to our mindset can help us implement them with our standard tools. This post demonstrates how the simple act of conducting tests by group can expand the universe of possible tests, boost the sensitivity of the existing suite, and help keep our data "on track". This feature is now available in dbt-utils.
Grouped checks
Group-based checks can be important for fully articulating good "business rules" against which to assess data quality. For example, groups could reflect either computationally-relevant dimensions of the ETL process (e.g. data loaded from different sources) or semantically-relevant dimensions of the real-world process that our data captures (e.g. repeated measures pertaining to many individual customers, patients, product lines, etc.) Such checks can make existing tests more rigorous while others are only expressible at the grouped level.
Only expressible
Some types of checks can only be expressed by group. For example, in a dataset containing train schedules across a transit system, an ARRIVAL_TIME field might not be unique; however, it would (hopefully) always be unique for a specific TRACK and STATION!
More rigorous
Consider a recency check (i.e. that the maximum date represented in the data is appropriately close to the present); if the data loads from multiple sources (e.g. tickets purchases through web, a mobile app, or a station kiosk), a check of the maximum date could pass the check if any one source loaded, but unless the data is grouped by source and each group's maximum date is checked, stale data could go undetected.
Case study: NYC subway data
To demonstrate the utility (or, should I say, necessity) of group-level checks, let's consider some real-world open data from the NYC subway system which I can always count on to have plenty of data quality quirks (which, to be clear, I do not say as a criticism; there's nothing unexpected about this in real-world "data as residue" data.). Cumulative entries through each turnstile across all subway stations are recorded 4x daily, creating a structure with one record for each turnstile and timestamp combination.
Of course, the information we want out of this data is probably not the cumulative count through some turnstile from some arbitrary start date but rather the station-level entries during a given period. So, in our transformations, we would take a lagged difference of the cumulative entries by turnstile and aggregate that up to the station-level. Just collating data from 5,000 sensors – what could go wrong, right?
However, that seemingly trivial lagged-difference transformation makes two key assumptions: the cumulative entries are monotonically increasing by turnstile and every time period observations is present for every turnstile.
These conditions illustrate the two benefits of grouped checks we mentioned before: monotonicity can only be assessed after grouping by turnstile (there's no reason the cumulative entry count should only go up when comparing observations across different turnstiles), and although the presence of given timestamps could be checked at the dataset level, it is substantially more rigorous when checked at the individual sensor level.
So what do we discover when we validate our data by group?
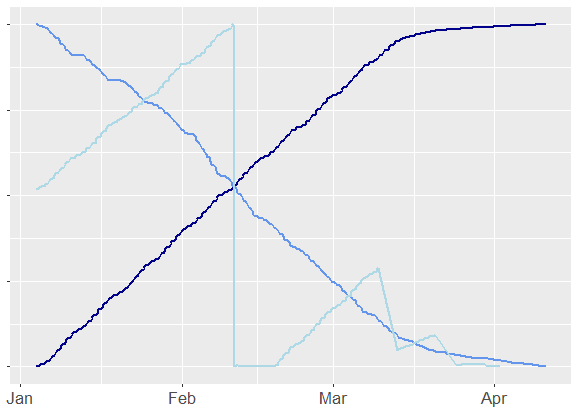
Testing for monotonicity, we find many poorly behaved turnstiles. Unlike the well-behaved dark blue line, other turnstiles seem to decrement versus increment with each rotation while still others cyclically increase and plummet to zero – perhaps due to maintenance events, replacements, or glitches in communication with the central server.
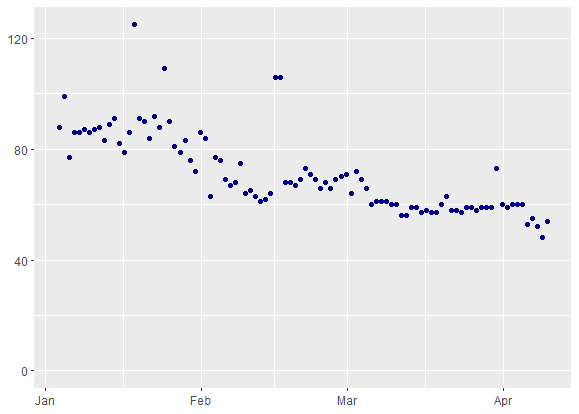
Similarly, while no expected timestamp is missing from the data altogether, a more rigorous test of timestamps by turnstile reveals between roughly 50-100 missing observations for any given period.
Check out this GitHub gist to replicate these views locally.
Right-sizing grouped checks
If the power of grouped checks comes from our knowledge of the underlying systems, this same knowledge can guide our understanding of their limitations and when grouped checks aren't the right answer.
Just like we can't inspect every tie on our railroad track, grouped checks represent a tradeoff between effort (both cognitive and computational!) and value. They are most effective when groups are related to specific points of friction in our pipeline which we are unable to test or control what happens further upstream.
Not all groupings are equally likely to break the data. In the subway example, turnstile-level failures are likely because each individual turnstile is independently involved in data collection and can break in its own unique ways. However, if we were working with clickstream data for our online ticket portal, the data collection process is centralized, so it would be unlikely for ETL to break in customer-specific ways and it would be cumbersome to execute checks by customer.
Even when grouped checks have merit, their need might be a "code smell" that suggests we could instead be doing simpler checks further upstream. Since grouped checks are most often needed to counteract the blending of multiple data lineages, where possible they could be rewritten as more typical tests applied to each branch of the lineage before consolidation. For example, it would be nice if we could check for monotonicity before aggregating sensor data. However, when we lack control of those upstream processes, grouped checks offer a practical alternative.
Now in dbt-utils!
If you're intrigued by the prospect of grouped checks, it's now possible to run these tests from dbt-utils. The 1.0.0 release brings grouping in tests to all relevant tests, specifically:
- equal_rowcount()
- fewer_rows_than()
- recency()
- at_least_one()
- not_constant()
- sequential_values()
- non_null_proportion()
Each check now has a group_by_columns argument which accepts one or more column names. For example, to check for a valid daily record for each turnstile in each station, we could add to our schema.yml file:
models:
  - name: turnstile_entries
    tests:
      - dbt_utils.recency:
          datepart: day
          field: recorded_at
          interval: 1
          # Check for recency for each turnstile_id at each station_id
          group_by_columns:
            - station_id
            - turnstile_id
Conclusion
And what should you do if your new data tests fail? This actually reveals the final benefit of hypothesis-driven checks: because you are testing for the failure of specific systems or processes, test results will direct your debugging attention towards the root cause of your data issue! Instead of embarking on a directionless quest, you'll immediately know where in your pipeline to focus your attention to get your system back on track.


Comments